France prides itself to be a nation of exceptional food culture, from gourmet Michelin-star restaurants to more casual establishments and lavish family dinners. The world largely agrees, and it led to heart-warming though strange recognitions, such as the UNESCO acknowledging the “French people’s cultural relationship to food, in their way of eating and cooking, and in their way of taking their meals”1UNESCO, 2010. People abroad seem to be fairly convinced of that as well, likely with a somewhat distorted perception focused on the top-notch dishes2See, e.g., Yougov, 2019.
At the same time, France also claims some achievements at odds with its reputation, such as being one of the largest markets for McDonald’s worldwide3McDonald’s, 2019. Food consumption is changing, and, as mentioned in the previous article, little is known about the environmental impacts of these behaviors, and how they differ by gender.
In this article, we will review the evidence on these issues, by focusing on French adults (aged 18-79), with complementary evidence on children and adolescents (0-17). This builds upon a representative survey of French food consumption (INCA3) and a database of the environmental impacts of individual food products (Agribalyse). Detailed evidence and databases are provided in the annexes.
In particular, we will explore:
- Gender differences in food consumption in France
- Environmental impacts caused by food consumption, with a focus on the gender dimension
- Analysis of the identified patterns
This article is part of a series. Click here to read the first article.
KEY TAKE-AWAYS
Food consumption patterns in France are largely aligned with those observed in other countries: males eat higher quantities of food than females, and the composition of their diet is different (e.g., more alcohol, more meat). Women are more aligned with health and environmental recommendations than men.
On average, males have higher environmental impacts from food consumption than females. Among adults, they pollute about 35% more for a synthetic indicator of impacts.
For all the 15 considered environmental impact indicators, males pollute more than females, but the size of the gap varies: it is highest for land use (43% more for men) and lowest for water depletion (19% more for men).
Beyond the averages, males are over-represented among the largest polluters due to food consumption, and females are over-represented among the lowest polluters.
Over their entire life, men are expected to pollute about 20% more than women due to food consumption. They pollute more at almost every age, but tend to die sooner – which slightly reduces the gap with women.
The fact that men pollute more than women for food consumption is primarily due to the fact that they eat more (49% of the difference), but also by the fact that they choose more impactful foodstuffs (44% of the difference). The rest is due to interactions between these causes.
Meat, starters/mixed dishes and beverages (especially alcohol) are the leading causes of environmental impacts for both men and women. Men pollute more for virtually all types of food. In some cases, it’s mostly due to the quantities they consume (e.g., meat) rather than to the fact that they choose foodstuffs with worse impacts.
Different factors explain the gender differences in environmental impacts from food. Individual differences (such as height, weight or basal metabolic rates) suggest that males need higher food quantities than females, regardless of their choices. Taking the base metabolic rate as a proxy for nutritional needs, we can expect that males would require 28% more calories than females, and thus pollute about 28% more. For some impacts, males indeed pollute about 28% more or even less (e.g., water or energy depletion). However, for many impacts males pollute more than what would be expected when considering this difference in nutritional needs (e.g., environmental footprint score, climate change…)
Differences in nutritional needs thus do not necessarily explain the entire differences in quantities consumed, and above all in the composition of the diet. Psychological and social factors (including gender norms and socialization) are notable causes of gender differences in food consumption, resulting in differences in environmental food impacts.

No French exceptionalism: gender differences in food consumption are largely consistent with other countries
The data from the INCA3 survey reveals that at a broad level, the French are not so different from other people when it comes to gender differences in food consumption. Indeed, French males consume higher quantities of food than females. Concretely, adult women consume about 2.7 kg of food (including beverages) every day, compared to 3.2 for men, i.e., circa 19% more. The gap is reduced to about 10% for the elderly above 65.
This pattern is visible from a young age: children and adolescents (who do not control their food consumption as finely as adults) also exhibit a gendered pattern in food quantities consumed. Interestingly, the gap is small until the very end of childhood, but jumps when kids are about 15-17 years old. There may be multiple reasons for this pattern (the most obvious being puberty), but there are difficult to substantiate4The peak in growth rates / differences in attained height seem to be slightly before that age range, see Fillod. We can also speculate that gender norms related to beauty standards increase around that time, though I am not convinced that they are less enforced in say, middle school-aged kids.
Young babies are also an exception in the overarching patterns, because among those below one, females eat more than males. I am unsure why, and the difference is small, so it could be an artifact (small sample, etc.).
When it comes to dietary choices, the composition of consumption tends to be quite similar between men and women, with the bulk of the diet consisting of beverages (slightly less than 60% of consumed quantities). Males eat more meat than females (4.1% against 3.3%).
This breakdown of diet composition between large food groups tends to hold across the different age groups. The noticeable exception is that beverages are less consumed for the elderly (above 65) for both females and males.
In absolute amounts, males eat more of virtually all food groups. The following graph shows the differences in quantities (kg) consumed by males compared to females over a year (focusing on adults). You can click on the broad categories to get access to a more detailed breakdown. Positive values mean that men consume more of this food group than females, negative values the opposite. In particular, men consume more beverages than females: more water, but critically more alcohol (52 kg more than women in a year). Men also eat more beef and pork than women. Some specific food groups are more consumed by females (e.g., turkey, soups…) but they tend to remain marginal in terms of sheer volume.
This situation is expected due to the sheer fact that men eat more overall than women. It can thus be useful to check consumption on a relative basis, i.e., which food groups are over or under-consumed by each gender, compared to their share in the diet of all adults. In the following graph, values below 1 mean that males (or females) consume less of this particular type of foodstuff as a share of their diet, compared to the average for all adults. Values above 1 mean the opposite.
Accordingly, we see that males largely over-consume alcohol (43% more than the average adult) and various types of meat (20% more than the average adult for beef), but also legumes, vegetables and some junk food. Females tend to eat a lot of creams, sorbets, soups, fruits, and turkey.
Interestingly with the INCA3 data, we can get down to the level of individual food items being consumed, but it’s obviously less reliable than specific groups of items. However, some factoids intuitively make sense, such as the fact that women overconsume water, smoothies, pasta salads or tea. Males by contrast feast on cognac, Ricard, beer, and various steaks.

Males have a much higher environmental impact than females when it comes to food consumption
Let’s get to the meat and potatoes of this essay (apologies for the pun): what are the consequences of these gendered patterns of food consumption on environmental impacts?
Thanks to the Agribalyse data, we can answer this question not only for climate change, but for a wide variety of environmental indicators, which include:

The environmental footprint score is a composite indicator giving a synthetic view of how the diet affects the environment (and to some extent human health). It is based on a weighting of the individual indicators, with coefficients to reflect their robustness and importance. It is derived from a methodology of the European Commission. As a consequence, it is a unitless metric. However, 1 Pt corresponds to the overall yearly environmental impact of an average European.
Adult female average yearly impact: 217 mPt
Adult male average yearly impact: 293 mPt (+35%)
Climate change corresponds to how the diet contributes to the modification of the climate (global warming, and other consequences). It is expressed in kg of CO2 equivalent (to take into account the different greenhouse gases linked to agriculture, including methane).
Adult female average yearly impact: 1726 kg CO2 eq.
Adult male average yearly impact: 2414 kg CO2 eq. (+39.8%)


Land use refers to the extent to which the diet degrades natural habitat, as land is a resource in limited supply, shared with other milieus (e.g., forests…). Land use has a strong effect on biodiversity. It is assessed in points.
Adult female average yearly impact: 84295 pt
Adult male average yearly impact: 120210 pt (+42.6%)
Ozone layer depletion characterizes how the diet damages this layer. The ozone layer, situated in the upper atmosphere, protects us from harmful solar UV radiations. As a result, its degradation can lead to increases in cancers. It is expressed in kg CFC-11 eq.
Adult female average yearly impact: 180 kg CFC-11 eq.
Adult male average yearly impact: 237 kg CFC-11 eq. (+31.7%)


Photochemical Ozone formation is a notable contributor to the degradation of air quality. Through this impact, the diet can notably produce smog, with adverse health impacts. Its unit is the kg NMVOC eq.
Adult female average yearly impact: 5721 kg NMVOC eq.
Adult male average yearly impact: 7630 kg NMVOC eq. (+33.4%)
Ionizing radiation is the impact from radioactivity, corresponding to the nuclear waste generated to get the necessary electricity for the diet. It is expressed in kBq U235 eq.
Adult female average yearly impact: 441 kBq U235 eq.
Adult male average yearly impact: 527 kBq U235 eq. (+19.5%)


Particulate matter takes a look at the release of tiny particles into the air, which can cause respiratory issues and contribute to air pollution, similar to dust or smoke. It is measured in E-06 disease inc. (ability to provoke human health problems).
Adult female average yearly impact: 160 E-06 disease inc.
Adult male average yearly impact: 224 E-06 disease inc. (+40%)
Soil and water acidification can be caused by the diet through its chemical emissions. These emissions enter the ecosystem, leading to phenomena such as acid rains. The measurement unit is the mol H+ eq.
Adult female average yearly impact: 22 mol H+ eq.
Adult male average yearly impact: 31 mol H+ eq. (+40.9%)


Terrestrial eutrophication means that the diet enriches the milieu too much in nitrogen. It leads to a disequilibrium and an impoverishment of the ecosystems. It mainly affects the agricultural soils. The corresponding unit is the mol N eq.
Adult female average yearly impact: 88 mol N eq.
Adult male average yearly impact: 124 mol N eq. (+40.9%)
Freshwater eutrophication is the last form of eutrophication considered, with excess nutrients generated by the diet having similar impacts than in the sea in freshwater milieus, such as rivers or lakes. Its impact is labelled in kg P eq.
Adult female average yearly impact: 299 kg P eq.
Adult male average yearly impact: 386 kg P eq. (+29.1%)


Marine eutrophication is a similar phenomenon than the terrestrial one: the diet causes an excess of nutrients in the sea, leading to a proliferation and asphyxia, especially though algae. It is measured in kg N eq.
Adult female average yearly impact: 7119 kg N eq.
Adult male average yearly impact: 9767 kg N eq. (+37.2%)
Freshwater ecotoxicity means that the diet contaminates the water environment. This tends to be less robust than other indicators. It is expressed in CTUe.
Adult female average yearly impact: 44704 CTUe
Adult male average yearly impact: 58665 CTUe (+31.2%)


Water resources depletion captures the impact of the diet in terms of water consumption. This indicator is adjusted for the relative rarity of water in the area (e.g., it is more impactful to consume one liter of water in the Sahara than in Brittany). It is measured in m3.
Adult female average yearly impact: 2266 m3
Adult male average yearly impact: 2700 m3 (+19.2%)
Energy resources depletion corresponds to the consumption of non-renewable energy resources caused by the diet. It mostly includes fossil fuels (e.g., coal, gas, oil…) and uranium. It is measured in MJ.
Adult female average yearly impact: 18773 MJ
Adult male average yearly impact: 24363 MJ (+29.8%)

Mineral resources depletion tracks how the diet uses nonrenewable mineral resources (including metals), such as copper, rare earth metals, sand… It is harmonized using kg Sb eq.
Adult female average yearly impact: 2788 kg Sb eq
Adult male average yearly impact: 3749 kg Sb eq (+34.5%)
What clearly emerges is that for all environmental metrics, male food consumption generates a higher impact than the female one. This fact is consistent across all age groups (even if the gap tends to be smaller in the older people, who also consume a lower quantity of foodstuff). Still, this gender gap is not perfectly stable depending on the specific environmental dimension under consideration. For instance, the male-female difference tends to be the lowest for the water depletion impact of the diet (19%). By contrast, the gap is the highest for the land use (43%).
In spite of these variations, the environmental footprint score, which is designed as a “summary” for all impacts remains highly relevant. Indeed, it is highly correlated with almost all other impacts, for both males and females. The following graphs show these correlations: each point corresponds to a single adult (male or female) and its individual environmental metric. X-values correspond to the environmental footprint score, y-values to the other different indicators. It clearly appears that the environmental footprint score is a great predictor of the other impacts, as shown by the high correlation coefficients (though the footprint is not very good to forecast some specific impacts, such as water depletion or ozone-related ones). This works for both women and men.
This means that we can focus on the environmental footprint as a reasonable overview of environmental impacts from diet for the rest of the analysis.
What we have seen so far was mostly focused on averages (even if the correlations shown above used the impact scores of individuals). Obviously, there are notable variations of diets within each gender – leading to important disparities of impacts. The following graph shows the distribution of environmental footprint score for both genders. X-values represent the impact (higher on the right) and y-values show how many people reach a particular score.
It clearly appears that the distributions of men and women’s impacts are different: the average female impact is lower than the male one (as mentioned before), but the entire distribution is shifted to the left. It means that, overall, women tend to pollute less via their food consumption then men. However, there are still some significant overlaps between the distributions: some men pollute less than some women.
Another way to look at it is to wonder what are the profiles of the top and least polluters. It can be done by looking at the deciles of environmental footprint score. Each decile covers 10% of the sample (both men and women). They are ranking by impact, so the first decile (D1) has the lowest environmental footprint score, while the last one (D10) has the highest score.
This analysis confirms that the group of people with the lowest environmental impact from food consumption (first and second deciles) is overwhelmingly composed of women. The reverse is true for the worst polluters.
Last but not least, we can take a lifecycle perspective. Following this logic, we can compare the environmental impacts from diets of males and females from cradle to grave (literally). This introduces some interesting elements, such as the initial period (infancy/childhood/part of adolescence), where eating decisions are (mostly) influenced by caregivers rather than individuals themselves (yet, we still see gender differences. The gender gaps in environmental impacts of food also fluctuate during adulthood. Moreover, the life expectancy of females is higher in France than for males, which reduces the gap at the very end – since for the few last years where an (average) woman consume food, the average man is, well, dead.
As such, the lifecycle should be considered as a synthetic estimate (assuming that individuals pollute at the average level of 2015 at each age group). It is in that sense similar to life expectancy.
With these caveats in mind, these are the produced curves for the cumulative environmental footprint score from food consumption by gender, depending on age.
Obviously, males pollute more over the entire lifecycle than females. Interestingly, the paths begin to truly diverge only from late adolescence/early adulthood onwards. The gap widens during all the adult life, as for all age groups, males have higher impacts than females. However, the exception is the very last years, since males are expected to die before females (about 79 vs 85). It leads to a plateau for males, while females continue to accumulate impacts in their 80s. Overall, men are expected to pollute about 19.8% more from their diet than females during their lives.
We have clearly shown a gender gap making males higher polluters than females for their diets, but what explains these patterns?

Several factors explain the gender difference in environmental impacts from food, some under individuals’ control, other less so
Several factors can be mobilized to explain why males appear to pollute more than females form their food consumption. Accordingly, different angles of approach can be used to tackle them.
A first way to do that is to decompose the gap between what is derived from eaten quantities and the impacts of a given quantity (i.e., the “environmental intensity” of the diet).
Indeed, when considering adults, males pollute on average 77 mPt more each year than females, of which:
- 48.5% is explained by the fact that men consume more food than women (quantity effect)
- 44.2% is explained by the fact that men choose more polluting foodstuffs than women (dietary choices effect)
- 7.8% is explained by the interactions between these factors
As such, the top factor is the fact that men eat more, closely followed by the fact that they make worse (on an environmental basis) decisions when selecting what they eat.
So, the question then moves to another level: why do men eat more? Why do they make different choices when composing their diet then women?
To understand the situation better, let’s take a closer look at the diets of both men and women. A possible way to do that is to check the impacts caused by the different macro groups of foodstuffs.
It clearly appears that meat, starters and mixed dishes and beverages are the main culprits for the environmental impacts linked to food consumption. This is true for both men and women. It also shows that males have higher impacts than females for virtually all categories of foodstuff (with the sole exception of eggs). Still, the gap in terms of impact varies substantially: it is very high for meat (men cause 59% more environmental damage than women when it comes to meat), and can be much smaller for other types of foodstuff (e.g., milk and dairy…).
However, this is not the full picture: as men tend to eat higher quantities than women overall, this is expected that they pollute more for almost all types of foodstuff. We can break it down further, decomposing the environmental impacts for each food group between differences in quantities and dietary choices. It would allow us to understand, for instance, why the environmental impact of men due to meat is so much higher than the one of women: is it because they eat higher quantities of meat or because the type of meat they eat is different? (e.g., they prioritize beef or lamb compared to women).
This graph decomposes the gender difference in environmental impacts by food group. Positive values mean that males pollute more than females, negative values the opposite. The net difference corresponds to the additional pollution generated by males for a given food group, and the three bars to the sources of this additional pollution.
The results imply that the differences in impact have different drivers depending on the food group. For meat, the overwhelming majority (77%) of the male surplus derives from the fact that males eat more meat than females. Only a small minority (16%) is linked to the fact that the food consumed by males pollute more per unit of mass. It means that the male over-pollution is (primarily) linked to quantities rather than to differences in choices of meat. Still, the choices of males tend to be more negative, for instance by prioritizing beef or other red meat.
In some cases, quantities are the almost exclusive source of differences in impacts, as seen for sweet products or fish/seafood.
For other food groups, the drivers may be different. For instance, for starters/mixed dishes and beverages, dietary choices (i.e., the fact that the foodstuffs selected by males pollute more for a given quantity) are the key drivers of the differences in total impacts. It can for instance, be linked to the fact that males drink more alcoholic beverages, which are more impactful than others.
Last but not least, for some food groups, women actually make worse environmental choices than men. For instance, the typical female diet for cereal products, fruits/vegetables/nuts leads to more impacts per unit consumed than for males. However, due to the fact that males eat more quantities, they have more impacts on balance.
A temptation would be to map these patterns directly to biological and socio-cultural factors: men eat more because they need more energy to sustain their bodies, and they choose to eat different stuff because they are influenced by different norms. However, that would probably be too simplistic. For instance, it is difficult to estimate “needs” from biological factors alone (e.g., are we talking in terms of quantities, energy? Needs may be influenced by socio-cultural factors as well, such as specialization in economic occupations, etc.). We’ll thus not be able to give a clear-cut answer on that (as far as it would even be possible), but rather to explore a few factors and check which ones could have a notable influence.
Individual characteristics may have a strong influence on how males and females pollute through their diets.
It includes characteristics such as height, weight or Basal Metabolic Rate5Basal Metabolic Rate (BMR) is the number of calories you burn as your body performs basic (basal) life-sustaining function.. In the sample of French adults, males are systematically heavier (+20.6%), taller (+8%) and with higher BRM (+27.8%) than females. These characteristics can be expected to yield higher energy and food needs for men (due to e.g., biological development patterns), and thus higher environmental impacts – all other things held equal.

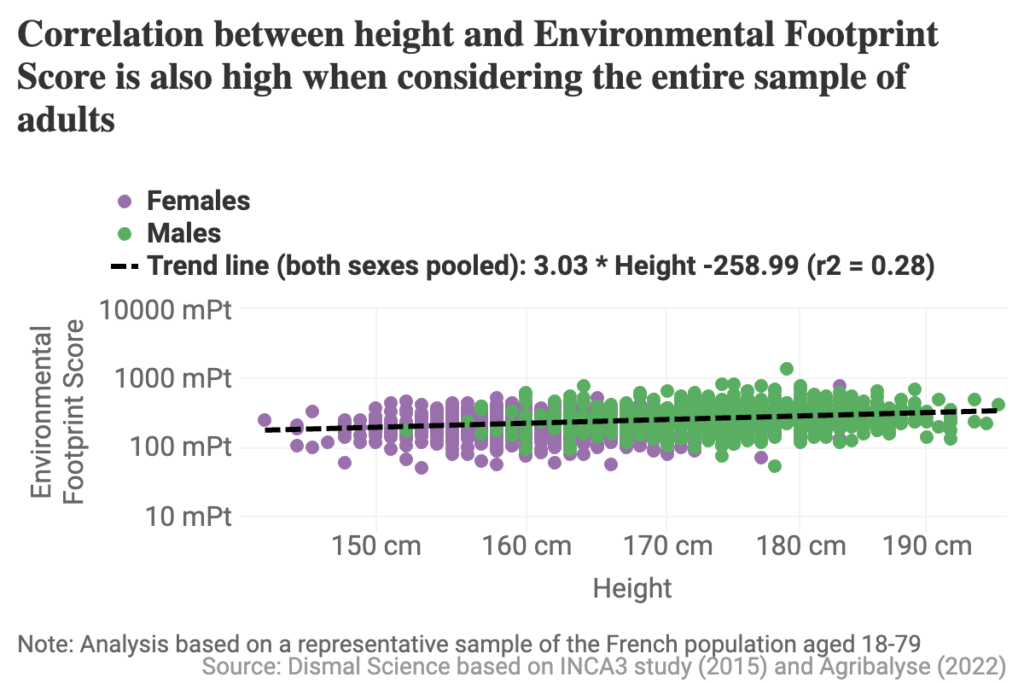
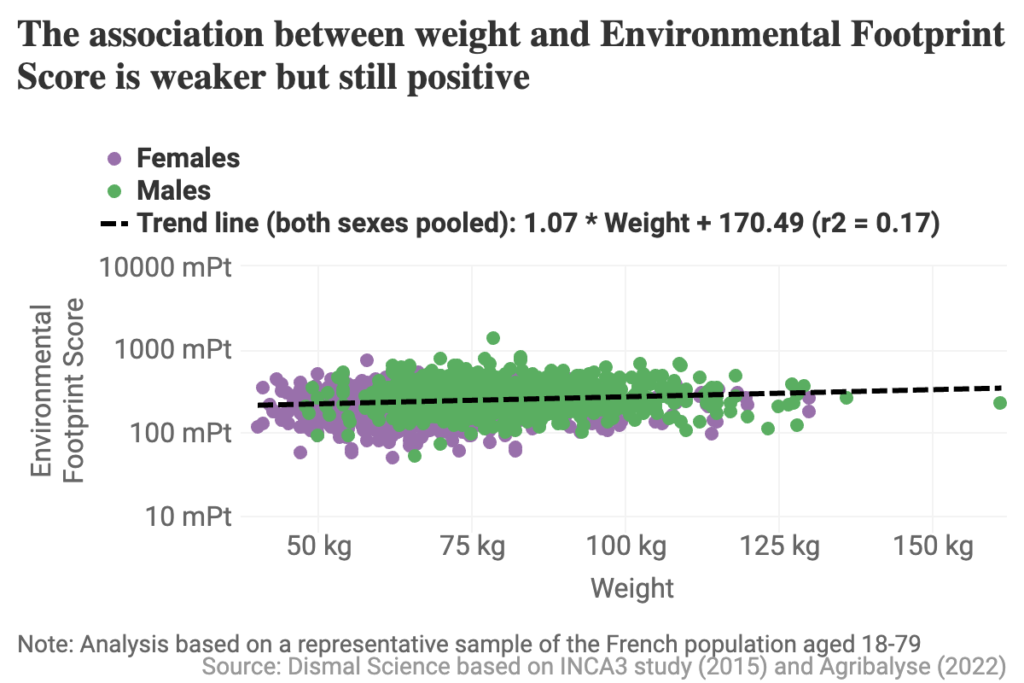
And indeed, these individual characteristics predict an important share of variations in Environmental Footprint Score, when considering the full sample (both men and women). It suggests that these may be an important origin of male over-pollution.
However, within each sex, the correlations between the environmental impacts and height, weight and BMR are much weaker, or even non-existent. This implies that, even within men, other factors play a key role in shaping the environmental impacts from food consumption, such as diet composition choices.
Beside these generic factors, pregnancies and lactation can also result to bumps in food consumption, but it corresponds to a limited number of years over adult life, and it is unclear if it should be attributed to the pregnant woman (vs the newborn, or even the couple). The ANSES sample is anyway too small to estimate the impact of these periods on food consumption/environmental damage.
Overall, we may expect males to pollute about 28% more than females based on their caloric needs (as proxied by the BMR). They do better than expected (i.e., polluting less than females when controlling for their needs) for some indicators (e.g., water depletion) but worse than them for most aspects (e.g., 35% more for the environmental footprint score, leaving about 7 percentage points unexplained by differences in nutritional needs).
Socio-economic specialization can also be a cause of differences in environmental impacts from food consumption. In particular, physical-intensive occupations require higher energy consumption, and thus (all other things equal) more pollution. We can obviously think about male-tilted occupations such as farming, fishing, construction, etc., but some female-tilted occupations also imply a high physical toll (e.g., personal care workers, nurses…)6See recent Eurofound study on gender equality at work for more granular details.
The data shows that indeed, farmers and manual workers tend to have the highest environmental impacts of all occupations, especially among men. However, interestingly, the gender gap is quite small among farmers (it could be an artifact due to a small sample size, notably for females).
Psychological and social factors also play a key role in shaping food consumption choices (both in terms of quantities and diet composition) depending on gender, and thus have an influence on the related environmental impacts.
The literature7e.g., Fournier et al., 2015 has notably highlighted the influence of the sexual division of labor, with females traditionally more involved in housework and the related care work (e.g., feeding children). As a consequence, the pressure to make the “right choices” falls more heavily on them. Even individually, it is enforced through the injunction to remain slim. It can have impacts on the composition of the diet (e.g., more vegetables…) and also on the consumed quantities (restrictions as compared to needs/wants…). Females also seem to be typically socialized in a way that tend to prioritize environmental and health concerns to a greater extent than males. It is notably relevant for meat or alcohol consumption (even though females tended to reduce the gap with males regarding alcohol in France during recent years8See Santé Publique France). Cultural perceptions of masculinity and feminity can also be strongly associated and enforced via certain food, such as red meat.
You can now go interactive and estimate your own impacts thanks to our simulator!

Methodological annex (for nerds)
In this section, I briefly present the methodology used to derive the estimates for this project.
I retrieved representative data on the food consumption of French adults through the ANSES INCA 3 study (performed in 2015). This data records the daily food consumption of individuals at the level of foodstuff, using a specific typology (INCA 3 codes). For instance, code 32 corresponds to avocados.
Thanks to this data, it is possible to compute the average daily consumption for the different food products, overall and for some specific age groups and sex. I thank the ANSES team for their support in setting up the technical declarations of the stratified surveys in R.
Then, I manually matched the INCA 3 codes for food products to the CIQUAL codes of food products in the AGRIBALYSE database. This ADEME database provides life cycle environmental impact assessments at the level of individual products. For instance, the CIQUAL 4003 corresponds to boiled potatoes. In most cases, the correspondence between the INCA 3 and the CIQUAL codes is very good, but not always perfect. It is one of the limits of this analysis. A quality score was attributed to each product (INCA3) to estimate this risk:
It shows that the quality of the matching tends to be good (48%) or perfect (22%), so the results should be fairly robust. Poor matches were mostly due to a lack of corresponding product in the AGRIBALYSE database. In such cases, the closest substitutes were attributed (e.g., beef for uncommon types of meat, etc.). Another important point is that tap water was not found in the AGRIBALYSE database, so another study was used to estimate the impacts for its consumption.
Since the AGRIBALYSE data provides impacts by quantity consumed, it is then possible to multiply this impact by the quantities consumed of the INCA 3 database. This way, we obtain summary statistics on the environmental impacts, both for individuals and for groups.
Then, different analyses and graphs were created using R. These analyses sometimes require further assumptions. In particular, for the lifecycle environmental impacts, the impacts of the age groups were smoothened over the life cycle.
The scripts and the different databases produced in the context of this project are freely available on Github.
Notes
- 1
- 2See, e.g., Yougov, 2019
- 3
- 4The peak in growth rates / differences in attained height seem to be slightly before that age range, see Fillod
- 5Basal Metabolic Rate (BMR) is the number of calories you burn as your body performs basic (basal) life-sustaining function.
- 6See recent Eurofound study on gender equality at work for more granular details
- 7e.g., Fournier et al., 2015
- 8