
Scientific research does not happen out of thin air. It is widely accepted that science strongly influences society through its discoveries and potential applications. However, it is also well established for a long time in sociology and philosophy of science that social aspects influence the scientific process itself. It has led to vivid (and ongoing) debates on how to translate this fact into concrete considerations and practices1See https://plato.stanford.edu/entries/scientific-knowledge-social/ for a short philosophical review. Endometriosis research obviously does not escape these challenges. In fact, it could even be considered an arch-example of the social issues linked to research due to its connection with gender2As noted with feminist perspectives on endometriosis and in particular its medical history, see, .e.g., https://www.routledge.com/The-Makings-of-a-Modern-Epidemic-Endometriosis-Gender-and-Politics/Seear/p/book/9780367078027.
The expectation is thus that the “Who” is likely to matter regarding endometriosis research. However, assessing how and to what extent is always challenging (but also fascinating!). In this article, I will not aim at reaching sweeping philosophical conclusions in that matter (because of sheer incompetence). However, I will explore the relationship between endometriosis research and two critical social factors, namely geography and gender.
Graphs may not be fully visible on cell phones. Using a computer is recommended for the best reading experience. The titles can be clicked to get a fullscreen version of the graphs.

Geography (countries and institutions)
Geography is essential to understand the effort dedicated to endometriosis research. Which places dedicate significant resources to studying the disease? It is relevant for the public debate to check whether one puts its money where its mouth is. It can be analyzed at different levels, from nations to specific institutions (e.g., universities, hospitals, companies…). It also allows for tracking whether there are some specificities in terms of topics covered by country or institution. These choices of priorities can then be open to discussion.
To study the geographical aspect, the adopted method relied on the institutions of the different authors (restricted to the first ten ones). The list of authors/institutions from the Dimensions database was enriched through external databases (e.g., ORCID, manual completion). Then, each institution was granted a unique code based on the GRID database. This attribution was performed automatically through a dedicated algorithm. When it was not possible, a code was devised manually. The different codes could then be linked to interesting characteristics, such as the geographical coordinates, the country, and the type of institutions.
This article will focus on the national level, while the next one will deal with specific institutions.

Gender
Gender is critical given the topic and also highly sensitive. Indeed, the weight of medical history in the long-term and recent scandals3For instance, a major endometriosis practitioner and researcher from France has been accused of rape in 2021 (see: https://www.francetvinfo.fr/sante/patient/gynecologue-parisien-accuse-de-viols-le-professeur-emile-darai-prive-de-ses-responsabilites-de-chef-de-service-a-l-hopital-tenon_4799743.html). Previously, a dubious study linking attractiveness and endometriosis has been retracted following years of social upheaval (https://www.theguardian.com/society/2020/aug/05/disgusting-study-rating-attractiveness-of-women-with-endometriosis-retracted-by-medical-journal) must be highlighted and acknowledged. It has been noted in some previous research that gender and gender diversity can influence scientific outcomes4See for instance this recent paper finding benefits in diversified teams for medical research: https://conference.nber.org/conf_papers/f153886.pdf, but also priorities and tested hypotheses. The gender of endometriosis researchers and whether it affects studied topics could thus be valuable insights. Gender norms would also be relevant but are more challenging to study.
The database of endometriosis publications includes the names of the different authors involved in their production. Last names are always present, and in many cases, the first names are also retrievable (either directly from the Dimensions database or through additional completion using ORCID). Gender was thus determined based on the analysis of the available first names (for the ten first authors of each publication). The attribution of the correct gender relied on an external database. The Namespedia website indeed allows the extraction of the share of male or female people for each first name. The authors from the endometriosis database were thus given a gender (male/female, binary spectrum) if their name had a probability of at least 75% of being male/female. Otherwise, they were classified as undetermined. Unfortunately, it was impossible to identify unique authors due to difficulties in processing names. However, this method still allows the determination of the level of effort by gender (i.e., number of author-publication pairs by gender). Sensitivity analyses with a threshold of 90% were carried out to ensure that results were robust.
Gender will be tackled in the following article, as this one is already going to be awfully long.
The polarization of endometriosis research
A first striking feature of endometriosis research is that it is heavily polarized across the world. Indeed, an overwhelming share of the produced publications hails from a relatively small number of highly developed countries. It is clear for the overall number of publications between 1925 and 2020.
Cumulative number of endometriosis publications by country (1925-2020)
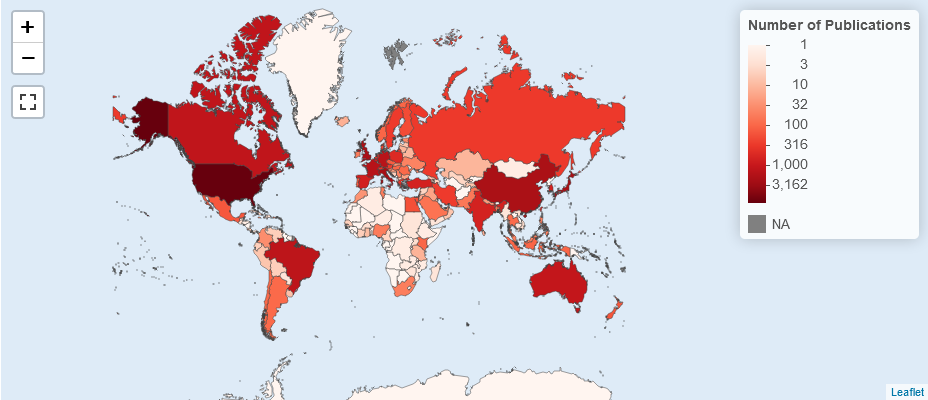
Note: Map based on 29,567 publications with a least one institution that could be geographically localized. Each publication is counted at most once for each country, even if multiple institutions from the same country are involved in this publication. However, a single publication can be counted for numerous countries (hence the sum of national shares is above 100%).
For instance, 8325 publications (i.e., 28% of the total with an attributable location) involve at least one institution based in the US between 1925 and 2020, revealing its striking domination. Other major contributors include Italy, Japan, France and Germany. This geographical pattern is not surprising because it is similar to what is seen for the whole scientific output. By contrast, developing countries still have a modest contribution in terms of publications, though some countries distinguish themselves as important players (e.g., China, Brazil, Turkey…). This situation is consistent with the finding from a previous geographical analysis of endometriosis research5See https://pubmed.ncbi.nlm.nih.gov/27653503/, which suggests that the dataset used in this project is of acceptable quality.
Of course, the number of publications is not the sole relevant indicator to determine the influence of a country in endometriosis research. The visibility (and, more controversially, the potential “quality”) of publications can be assessed by counting the citations received by publications from each country. The distribution of citations is shown on the following map for the papers published between 1925 and 2020.
Cumulative number of citations received by endometriosis publications by country (1925-2020)
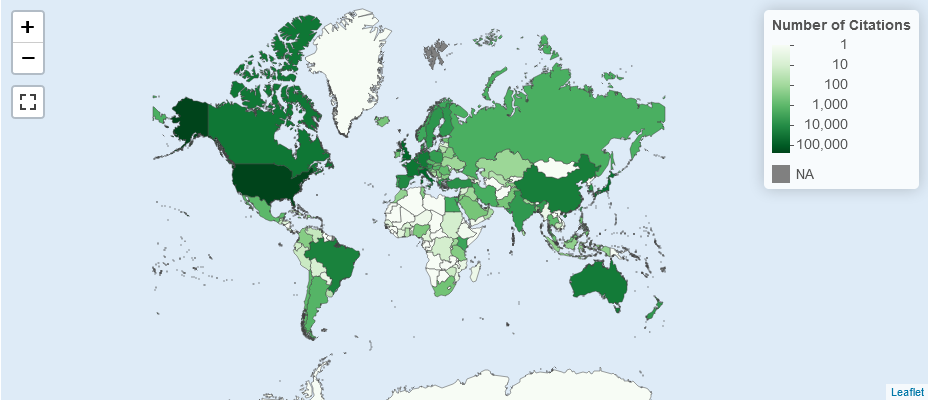
Note: Map based on 29,567 publications with a least one institution that could be geographically localized. The total citations received for each publication are counted at most once for each country, even if multiple institutions from the same country are involved in this publication. However, citations received by a single publication are counted for all the involved countries (hence the sum of national shares is above 100%).
Taking visibility into consideration, we see that the polarization of research is not attenuated! There is a strong correlation between the number of publications and citations, even though there are some clear over and underperformers.
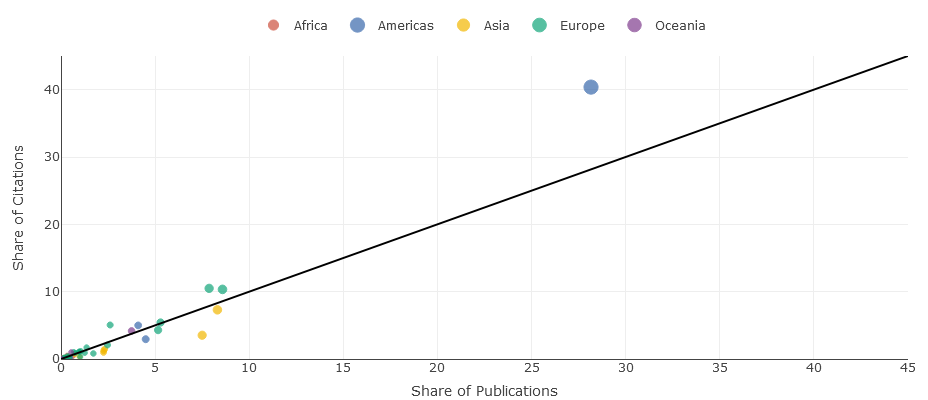
Note: Graph based on 29,567 publications with a least one institution that could be geographically localized. Data processing is the same as for the previous maps. Countries on the black line have the same share of citations and publications. Countries above the line are overperformers, meaning that they receive a greater share of citations than expected for a given share of publications, suggesting higher-visibility/”quality”. Countries below the line are instead underperformers on that metric.
In particular, American domination is even strengthened by this comparison. The USA represents over 40% of citations for only 28% of publications. By contrast, Asian countries, such as China and Japan, tend to underperform, collecting fewer citations than expected for their share of publications.
Different factors can explain this situation, including but not restricted to: differences in spending allowing greater quality/visibility, the use of the English language favoring international diffusion, the different years of take-off of endometriosis research (favorable to “old” countries of R&D like the USA), etc.
However, to grasp the whole picture, it is essential to also look at the dynamic dimension of endometriosis research. Things are not set in stone, and as time progresses, the relative importance of the different countries shifts. It is clear from this animated graph showcasing the evolution of the top producers of endometriosis research since 1925. You can control the animation and the visible continents by clicking on the corresponding buttons/labels.
Note: Graph based on 29,567 publications with a least one institution that could be geographically localized. Each publication is counted at most once for each country, even if multiple institutions from the same country are involved in this publication. However, a single publication can be counted for multiple countries.
The leadership of the United States has been apparent since the beginning of the considered period. However, there are also some rising contenders, especially since the 2000s. For instance, nations such as China or Italy have experienced notable growth in endometriosis publications in recent years. This diversification of the origins of endometriosis research can be intensely beneficial, provided that high standards of quality accompany it (which is sometimes questionable).
These recent changes can be substantiated by looking at the same maps as previously but focusing on the publications from the 2010s only.
Number of endometriosis papers published in the 2010s by country
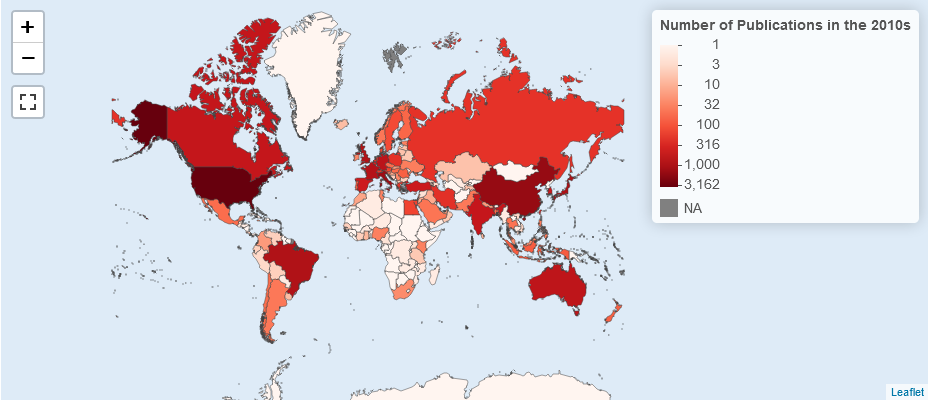
Note: Map based on 13,618 publications from the 2010s with a least one institution that could be geographically localized. Each publication is counted at most once for each country, even if multiple institutions from the same country are involved in this publication. However, a single publication can be counted for multiple countries (hence the sum of national shares is above 100%).

Note: Map based on 13,618 publications from the 2010s with a least one institution that could be geographically localized. The total citations for each publication are counted at most once for each country, even if multiple institutions from the same country are involved in this publication. However, citations received by a single publication are counted for all the involved countries (hence the sum of national shares is above 100%).
The relative decline of some major players, such as the US, is well visible. American publications represent “only” 23% of publications and 30% of citations for the scientific output published in the 2010s, compared to 28% and 40% over the entire studied period, respectively. The rise of China is also notable, as it has reached 11% of publications and 9% of citations in the 2010s. However, the basic pattern where developed countries contribute the lion’s share to endometriosis research still holds firm.
A priority for whom? Facts behind the headlines
Prominent and wealthy countries dominate the bulk of endometriosis, but this merely reflects their potential to dedicate substantial resources to scientific advances in general. Indeed, we cannot realistically expect a small country, let’s say, Belgium, to produce the same number of publications as the USA. It is perhaps more interesting to understand the relative prioritization of endometriosis research to inform the policy debate, i.e., to control for the differences in size between countries. This method will allow us to see which countries really prioritize this disease to the extent of their capabilities.
There are different ways to do that, each with benefits and limits. For this analysis, I will focus on the total population, as high-quality data is available for the different countries. Specifically, I use the United Nations demographic data from the 2010s to perform a per capita analysis of publications. The map showing the publications per capita tells a very different story from the absolute numbers.
Number of endometriosis papers per capita published in the 2010s by country
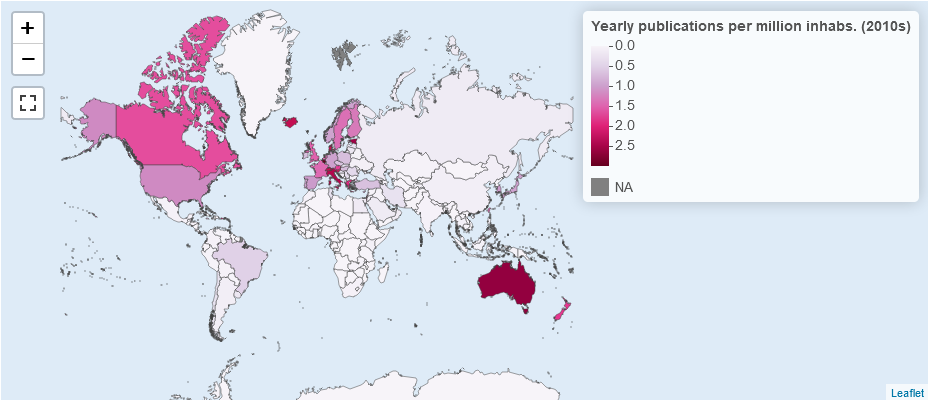
Note: Map based on 13,618 publications from the 2010s with a least one institution that could be geographically localized. Each publication is counted at most once for each country, even if multiple institutions from the same country are involved in this publication. However, a single publication can be counted for multiple countries. Demographic data is extracted from the 2019 UN population dataset6https://population.un.org/wpp/Download/Files/1_Indicators%20(Standard)/EXCEL_FILES/1_Population/WPP2019_POP_F01_1_TOTAL_POPULATION_BOTH_SEXES.xlsx. The figures are presented as average yearly publications per capita. Countries with a ratio above three are excluded from the analysis. It includes the Vatican, which had a skyrocketing ratio due to its tiny population (and I am not very convinced that it is meaningful to consider the Holy See as the Paradise of endometriosis R&D).
From this perspective, major contributors to endometriosis research, such as the United States, but even more critically, China, become far less important. This evidence suggests that their role is linked to their size and global influence in R&D rather than to a strong focus on endometriosis per se. By contrast, some small countries emerge as the true leaders prioritizing endometriosis R&D. In particular, Belgium ranks highest in the world, with an average of almost three endometriosis publications per million inhabitants each year in the 2010s. Australia, Estonia and Italy are also solid performers on that metric.
Despite these differences, the research landscape remains dominated by wealthy countries. This influence can be explained by the fact that, for the same population, they can more easily afford to dedicate substantial resources to R&D, as compared to developing countries. This metric is a little unfavorable to the developing world and should not be considered the end of the story. An alternative could be to look at the number of produced endometriosis publications for a given amount of economic output. I thus compute the yearly number of publications in the 2010s standardized by GDP. Of course, looking at publications per GDP can inflate the figures artificially for countries with a very low GDP, but it can bring another complementary angle.
Number of endometriosis papers per trillion of GDP (euros2020) published in the 2010s by country
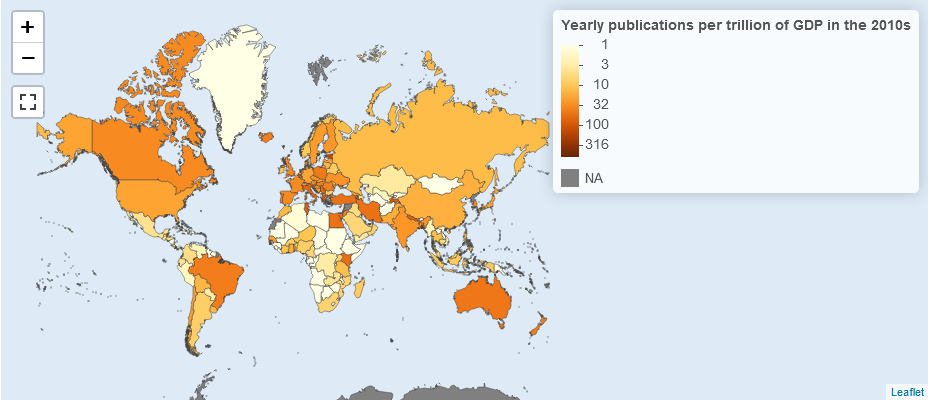
Note: Map based on 13,618 publications from the 2010s with a least one institution that could be geographically localized. Each publication is counted at most once for each country, even if multiple institutions from the same country are involved in this publication. However, a single publication can be counted for multiple countries. Economic data is extracted from the World Bank dataset7https://data.worldbank.org/indicator/NY.GDP.MKTP.KD. The original amounts in current dollars are converted to real 2020 euros using exchange rates data from OFX8https://www.ofx.com/en-au/forex-news/historical-exchange-rates/yearly-average-rates/ and inflation data from Inflationtool.com9https://www.inflationtool.com/euro. The figures are presented as average yearly publications per trillion of euros of GDP. Tuvalu is excluded due to an aberrantly high ratio.
In terms of economic potential, the situation is thus different. The countries that publish the most endometriosis publications regarding their GDP include small nations, many of them from the developing world (e.g., Gambia, Grenada, Jamaica…). Big developing countries, such as China and India, fare much better when considering their economic strength than their population. The US still emerges as a country that dedicates relatively little effort to endometriosis R&D as compared to its prosperity. Finally, some countries already identified as leaders also fare very well according to this metric, such as Estonia, Belgium, or Italy.
Unfortunately, studying citations per capita or per unit of economic product is a little bit difficult to interpret, so I will stick to the number of publications. But visibility and quality are key features that should be kept in mind to ensure that the produced R&D is relevant and (hopefully) helpful. In any case, it is clear that a small number of countries still dominate the endometriosis R&D arena (e.g., USA, Italy, China, Japan…), with some of them (e.g., Belgium, Italy, Australia, New Zealand…) emerging as players truly prioritizing this disease.
Not all looking in the same direction? National priorities for endometriosis R&D
Another interesting point to feed the debate on endometriosis R&D is to identify researchers’ priorities in different countries. As public money funds a large share of the effort, people have a right to know what is explored thanks to their support. The following maps will thus describe the most common or the most specific topics in each country. The most common topics (both broad and detailed) are simply those that hold the highest share of the abstracts for publications hailing from a given country. The most specific topics (both broad and detailed once again) refer to those whose share in the country’s publications deviate the most from the world average. Essentially, these are the most overrepresented topics in the country, even if they only account for a small share of the total scientific output.
For the broad topics, the most common ones are overwhelmingly “causes and mechanisms” (48 countries) and “treatment” (63 countries). It is not surprising as they are the most common topics overall. Moreover, they often only represent a minority of the national scientific output (e.g., about 20%). The few countries that differ from this situation are mainly developing countries in Africa and Asia, which have only published a handful of papers – which can then be trickier to interpret than a lengthy track record of contribution to R&D.
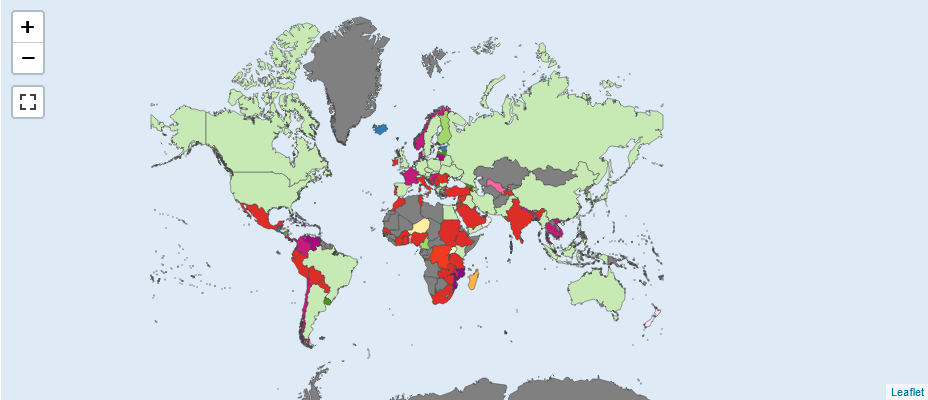
Most common broad topics by country (1925-2020)
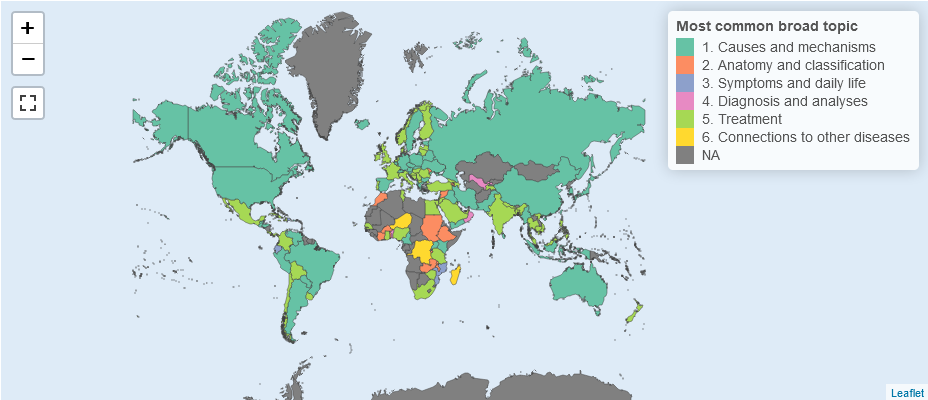
Note: Map based on 25,378 publications with a least one institution that could be geographically localized and an abstract allowing the attribution of topics. The share of topics at the national level corresponds to the simple average of the shares of all publications with a least one institution from that country. The broad topic with the highest percentage is shown on the map.
On that metric, the research priorities thus seem very similar across the world. Obviously, analyzing the most overrepresented broad topics yields more diversified results, as shown on the following map.
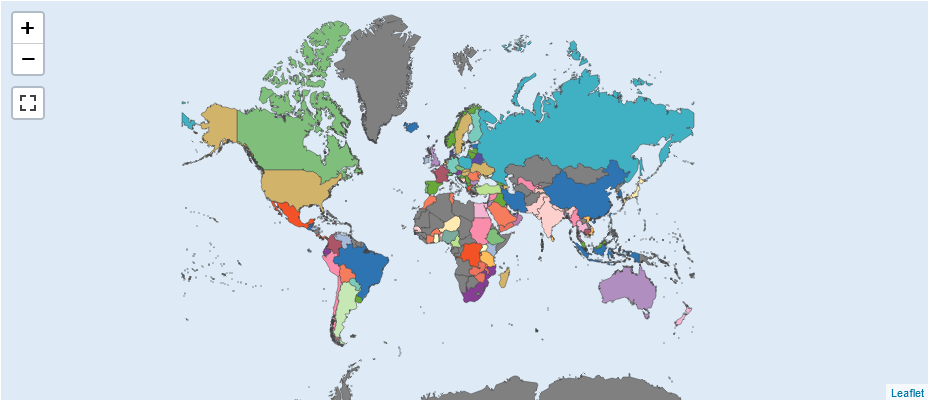
Most specific broad topics by country (1925-2020)
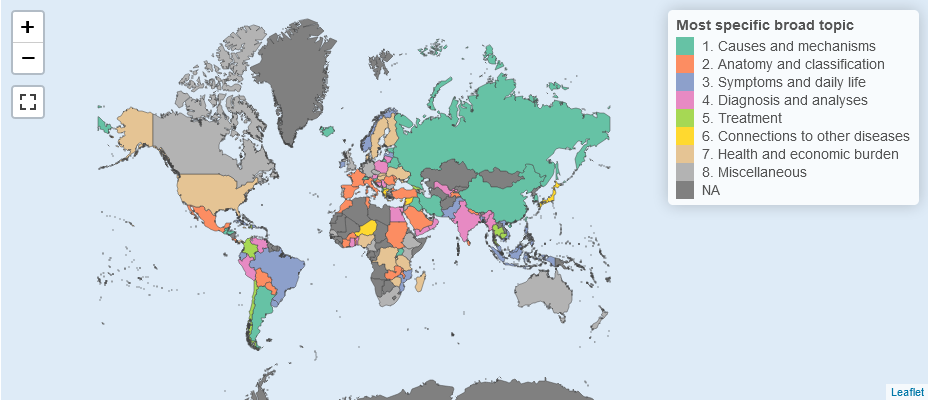
Note: Map based on 25,378 publications with a least one institution that could be geographically localized and an abstract allowing the attribution of topics. The share of topics at the national level corresponds to the simple average of the shares of all publications involving a least one institution from that country. Ratios of these shares to the overall sample are then computed to spot over and underrepresented topics at the national level. The broad topics with the highest ratio (i.e., the most overrepresented) are shown on the map.
In this case, we can see the first evidence of diverging national priorities. For instance, some countries are more strongly involved in “anatomy and classification” issues than the world average, such as France or Italy. This broad topic is the most overrepresented in the highest number of countries, as it holds this distinctive position in 27 countries. “Causes and mechanisms” remain an important topic for many countries, especially in Asia. By contrast, “Treatment” almost disappears from the map (ranking top in only eight countries). It may suggest that even if it represents the bulk of R&D in raw importance, few countries distinguish themselves by putting an even greater share of their scientific output for this endeavor. The smallest broad topics, i.e., “health and economic burden” and “miscellaneous”, become visible on the map – in a pretty high number of countries (20 and 22 respectively). They represent a minimal share of total scientific output, so it makes sense that the overrepresentation ratios may be very high for some countries.
Moving to detailed topics is more interesting to check whether researchers from different countries have particular priorities. However, they are also more sensitive to statistical flukes and should thus be interpreted with some caution. For the most represented detailed topics, we can still identify some patterns.
Most common detailed topics by country (1925-2020)
Note: Map based on 25,378 publications with a least one institution that could be geographically localized and an abstract allowing the attribution of topics. The share of topics at the national level corresponds to the simple average of the shares of all publications involving a least one institution from that country. The detailed topic with the highest percentage is reported on the map.
The detailed topics dedicated to “detailed description of specific subtypes” and “various or mixed biological mechanisms” are by far the most common, ranking first in 43 and 42 countries, respectively. For the description of subtypes, this specialization mainly occurs in developing countries. It could be explained by the relative ease of conducting such research for surgeons. For the biological mechanisms topic, this could be explained by the fact that causes are usually a strong focus of R&D and by the “catch-all” nature of this particular topic. “Specific surgical techniques and interventions” is also a common detailed topic, reaching the first position in 19 countries. Other detailed topics constitute niches and tend to be linked to countries with a small R&D output.
Last but not least, when we take a look at the overrepresented detailed topics, the map is much more fragmented.
Most specific detailed topics by country (1925-2020)
Note: Map based on 25,378 publications with a least one institution that could be geographically localized and an abstract allowing the attribution of topics. The share of topics at the national level corresponds to the simple average of the shares of all publications with a least one institution from that country. Ratios of these shares to the overall sample are then computed to spot over and underrepresented topics at the national level. The detailed topics with the highest ratio are shown on the map.
Notes
- 1See https://plato.stanford.edu/entries/scientific-knowledge-social/ for a short philosophical review
- 2As noted with feminist perspectives on endometriosis and in particular its medical history, see, .e.g., https://www.routledge.com/The-Makings-of-a-Modern-Epidemic-Endometriosis-Gender-and-Politics/Seear/p/book/9780367078027
- 3For instance, a major endometriosis practitioner and researcher from France has been accused of rape in 2021 (see: https://www.francetvinfo.fr/sante/patient/gynecologue-parisien-accuse-de-viols-le-professeur-emile-darai-prive-de-ses-responsabilites-de-chef-de-service-a-l-hopital-tenon_4799743.html). Previously, a dubious study linking attractiveness and endometriosis has been retracted following years of social upheaval (https://www.theguardian.com/society/2020/aug/05/disgusting-study-rating-attractiveness-of-women-with-endometriosis-retracted-by-medical-journal)
- 4See for instance this recent paper finding benefits in diversified teams for medical research: https://conference.nber.org/conf_papers/f153886.pdf
- 5
- 6
- 7
- 8
- 9


