Urban density often gets a bad rap. What comes to mind is typically bleak pictures of overcrowding, crumbling infrastructures and bad quality of life. Yet it can correspond to strikingly different realities. It is not only endless patches of decaying housing projects but also affluent neighborhoods!
I have recently stumbled upon the work of Alasdair Rae, a British analyst who produced beautiful maps of the areas with the highest densities in each US State. I thus carry on my “tradition” of stealing original ideas from the Anglosphere (see here) to generate new articles (I am currently working on a large-scale, 100% original project, but it will still have to wait… keep posted).
Soporific tax data can be (somewhat) exciting!
This article does not have very strong analytical ambitions. I would rather present a snapshot of what density actually looks like today in France. To answer this simple question, I rely on the new FILOSOFI dataset from INSEE. This dataset “cuts” the French territory into “grids”, which are essentially squares with granular geographical information (for instance for tax-related issues). The dataset also contains information on the population of these grids. I thus take the 1 km x 1 km squares and take a look at their density across France. (There are lots of complex and boring technicalities I skip here, but obviously the results would depend on how you define the squares – and as you will see there are some strange results).
If we look at the distribution of the densities of these grids, we obtain this: (note the scale is logarithmic!)

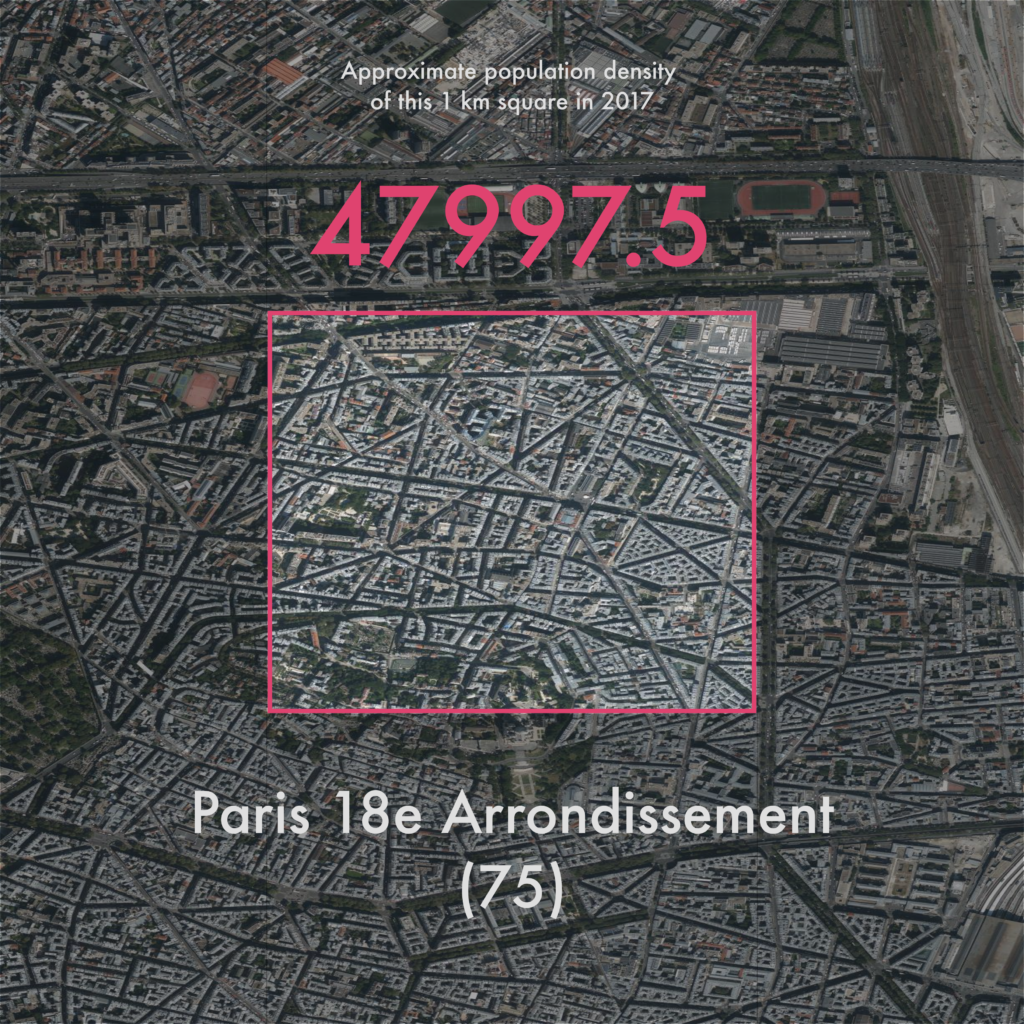
Without any surprise, the neighborhood with the highest density of the country is located in Paris (it is a part of the 18th arrondissement). But what does it look like on the ground (or more accurately, from a bird’s eye view)?
Turning everything into maps
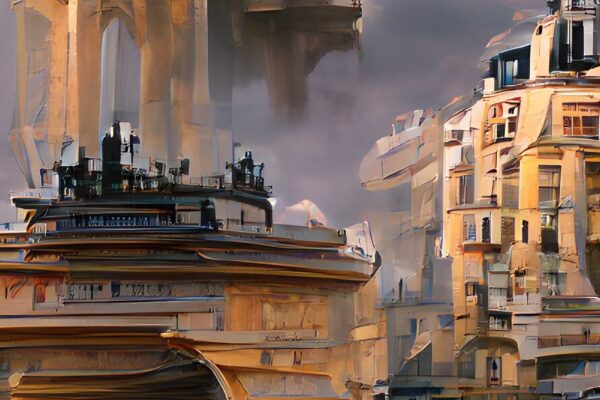
Here I rely on data from the IGN/Geoportail, which allows the extraction of detailed aerial maps of the French territory. So here is the famous tract of land with the highest density in France:
Quite packed! This is the area of Paris very close to Seine-Saint-Denis.
However, as mentioned earlier, density does not always look the same. To get a more “representative” view, I check the 1 km squared areas with the highest population density in each French département. (Hence the 96 shades of density!). Here are the locations of these areas (red = more dense).
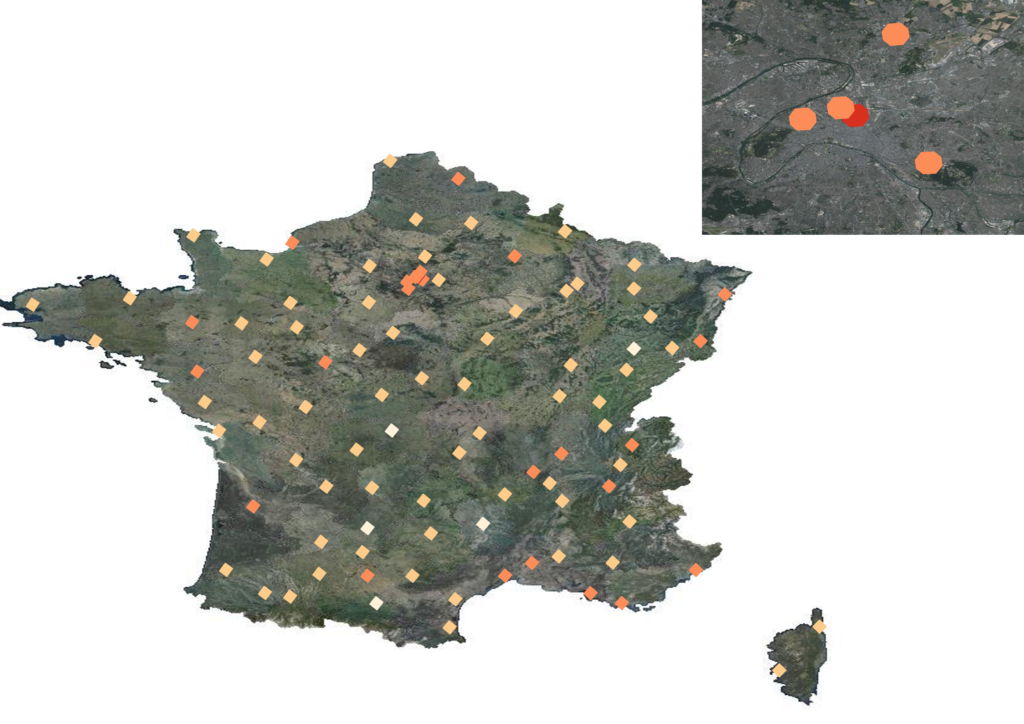
They are all represented as maps in this GIF. So you can see what the area where people are the most concentrated in your region looks like!
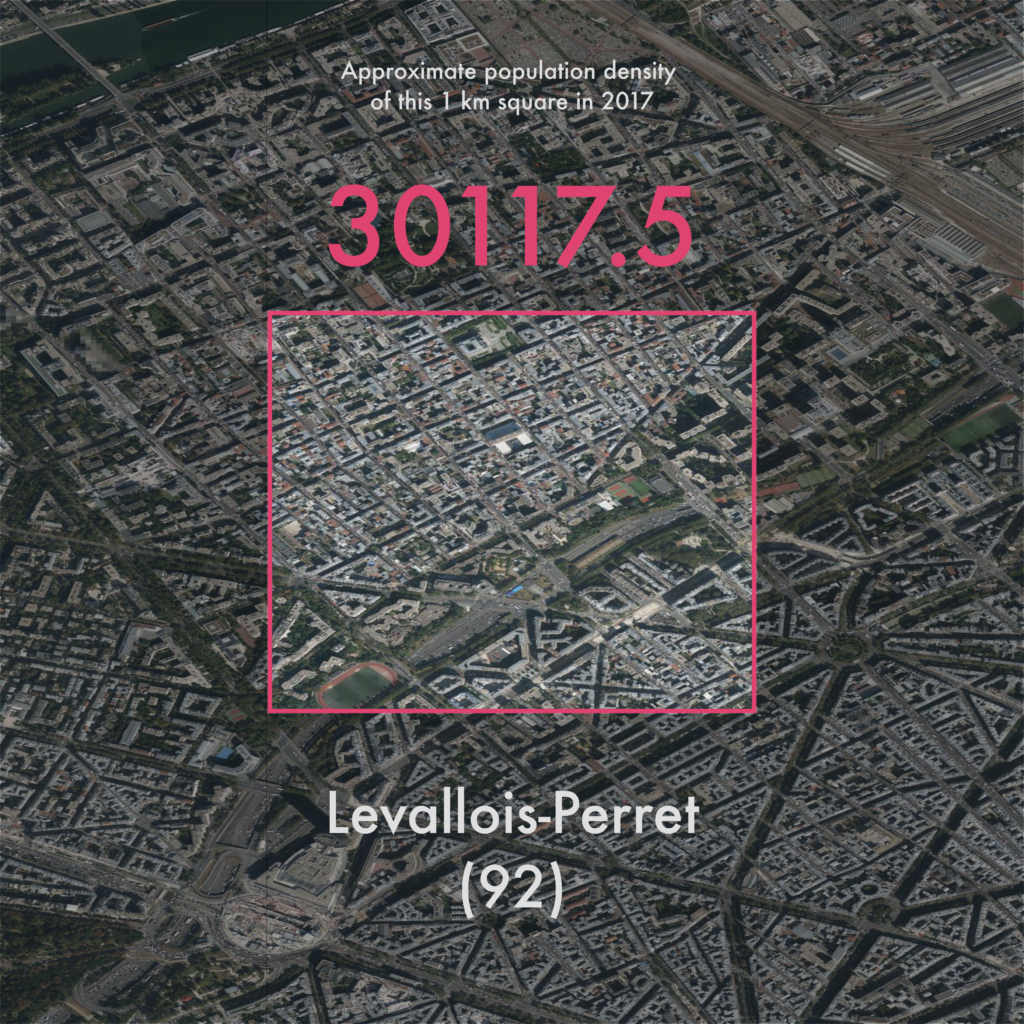
We can clearly see that we get a lot of different situations, from “dense” areas that are very suburban:
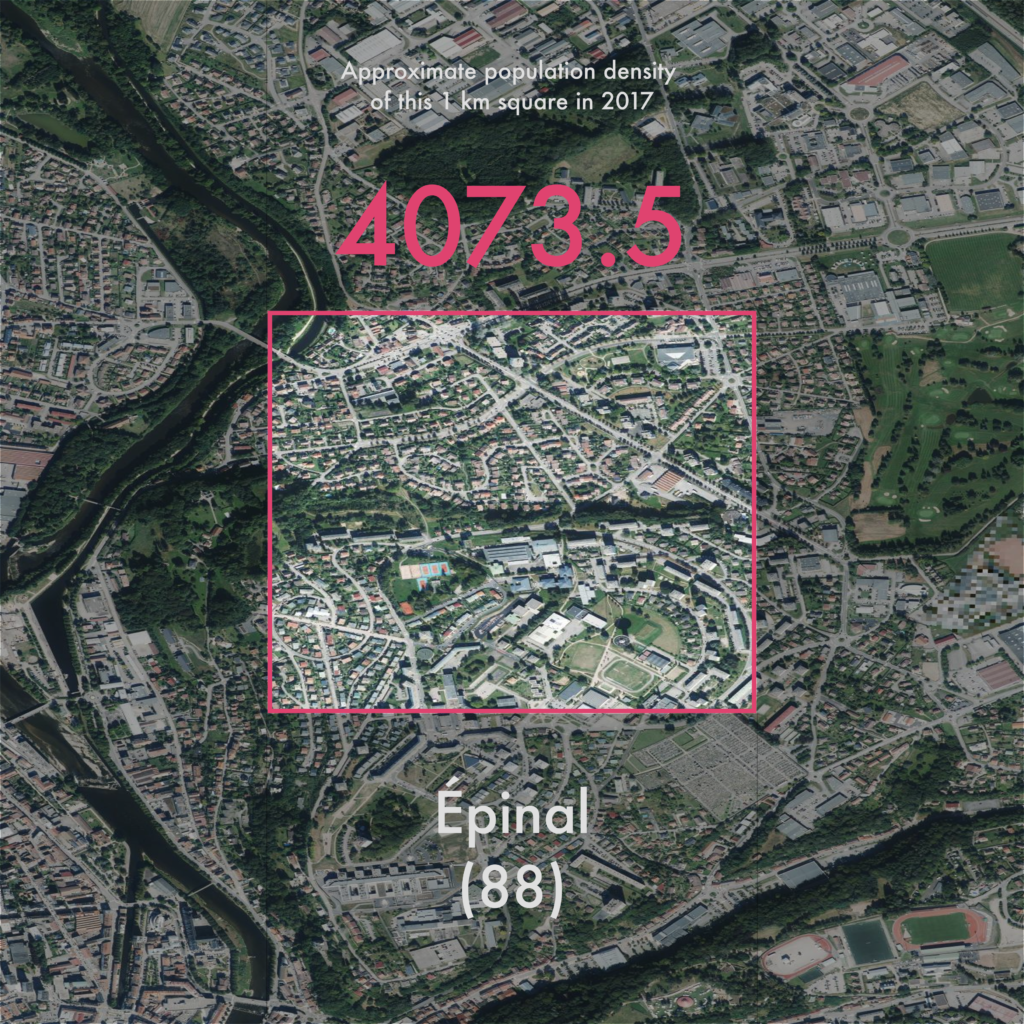
To big housing projects:

To places that are far from miserable!
All the départements in high-quality pictures
You can find the images of all locations here.
Density has many faces. Whether it’s a good or bad thing is up to you.